
So you want to know who is coming to your Shopify store? Makes sense– you are trying to sell product and grow your business, after all!
With Shopify’s traffic metric reporting, it is easier than exlorer to explore the way customers arrive at and move through your site. Not only is the interface easy to navigate, but it should also be one of your daily activities, as the analysis is incredibly important to the success of your store.
Whenever you see an increase or decline in sales, it can always be traced back to the way traffic finds and navigates your site. This information can help you determine digital marketing strategies, SEO needs, and site weaknesses. It is a must, and here’s how you do it.
Why Shopify Traffic Analytics Matters More Than You Think
Here’s the thing. Traffic analytics isn’t just a list of numbers sitting in your dashboard. It’s the story of your store. Every visitor, every click, every cart, these are clues. Together, they show you how people are finding you, what’s working, and where things might be slipping through the cracks.
Think of your Shopify traffic analytics as a window into your customers’ behavior. It tells you if your SEO is doing its job, whether your ads are pulling in the right people, and which pages or products are converting the best. Without that insight, you’re just guessing.
And the store owners who grow fastest? They aren’t guessing. They’re tracking this data consistently, spotting trends, and making smart moves based on what they see.
It’s not just about reacting when sales drop. It’s about recognizing the little wins, too. Maybe a new blog post quietly started driving traffic. Or a product got picked up by a niche site. This dashboard helps you see those moments early so you can double down.
So yes, you should absolutely be checking this regularly. Even five minutes a day can help you catch opportunities and avoid costly mistakes.
Your traffic report isn’t just a chart. It’s a map. Use it.
Step #1: Go to the admin section of your Shopify store then click “Analytics”
Step #2: Scroll down. There you will find traffic metrics and sales overview and more. Analytics Dashboard gives you overview of the following;
- Total Sales
- Online Store Sessions
- Returning Customer Rate
- Online Store Conversion Rate
- Average Order Value
- Total Orders
- Top Products by Unit Sold
- Online Store Sessions by Traffic Source
- Sales by Social Source
- Top Referrers by Sessions
- Online Store Sessions by Location
- Sales Traffic by Source
- Top Landing pages by sessions
- Sales by POS location
- Online Store Sessions by Device Type
- Online Store Sessions by Social Source
- Total Sales Attributed to Marketing Campaigns
- Sales by Staff
Okay, but what does each reporting metric mean?
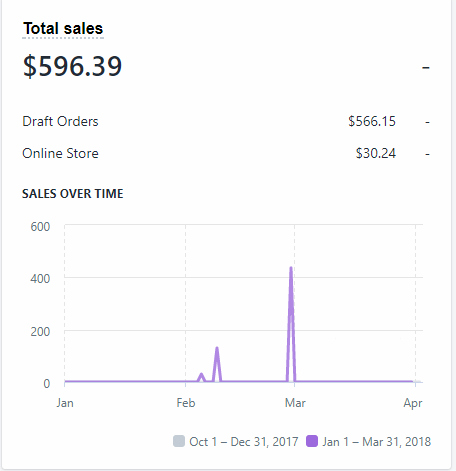
Total Sales
The overview gives us the Total Sales that can be narrowed by the date range indicated. Sales over time, gives you view of a line graph
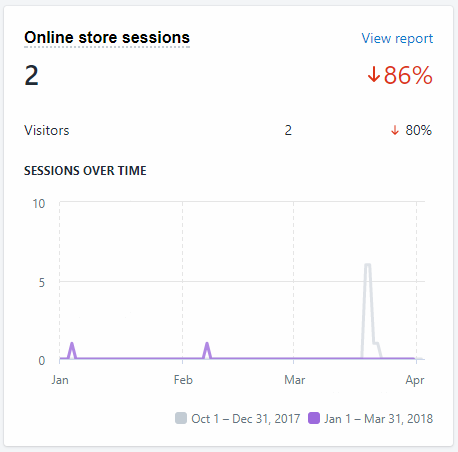
Online Store Session
This gives you the number of visitors that visited your site and the Sessions Over Time
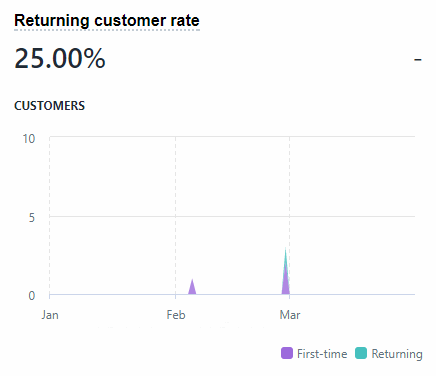
Returning Customer Rate
Shopify also helps you know if you’re customers revisits your site. This data also shows the percentage of the First-time customers (in purple legend) and which are the Returning customers (in cyan legend)
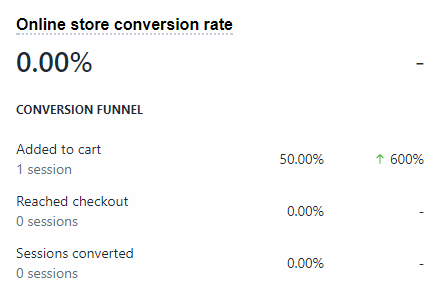
Online Store Conversion Rate
This part of the dashboard helps you keep track of the visitors in your site. Your goal is to sell items and not just gain visitors that does not purchase your merchandise. Online Store Conversion Rate lets you know if how many customers Added to Cart, Reached checkout and how many Session Converted.
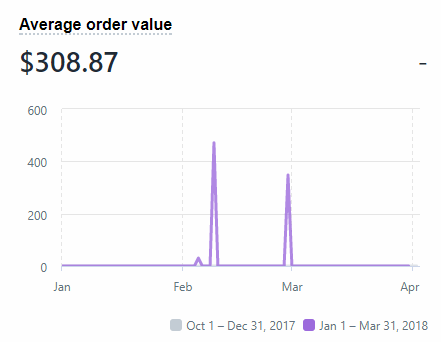
Average Order Value
This is the total value of all orders- including all means of expenses minus the value of return, divided by the total orders for the time frame set.
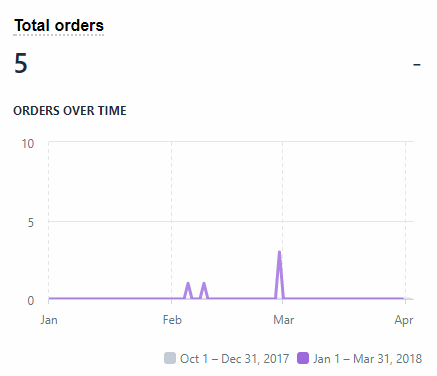
Total Orders
This graph shows you the total orders over time – of the specific date range you have set above
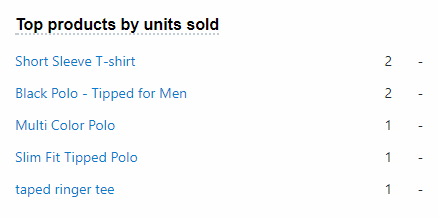
Top Products by Unit Sold
Shopify automatically shows you your best selling product by this statistics.
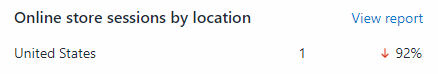
Online Store Sessions by Location
You can easily identify which area is your best market and you can either continue or change your strategy by targeting customers as per their locations
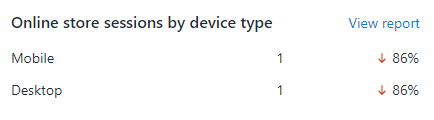
Online Store Session by Device Type
This report helps you know the device used in visiting your site. It can either be via mobile or desktop. This will help you improve areas like mobile responsiveness and the like.
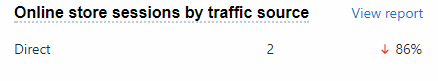
Online Store Sessions Traffic Source
The “Traffic Source” shows you where your visitors are coming from, and is divided into 3 parts.
The first “Traffic Source” to assess is “Direct.”
These visitors have come to your store directly, by entering your URL into their browser. They already know about your product, and they were coming directly for it!
The second is “Referrals or Social Source”
These visitors have found your store by clicking on link on a different website. Perhaps this was a blog, or on Facebook, or you got really lucky and you made it to the front page of the New York Times website. Either way– they each got to your store from somewhere else, and did not enter any information into a search bar, or URL bar.
To see who exactly is referring to you, evaluate the “Top Referrals” list on the right. Here, you can find the most frequently referring sites.
The third “Traffic Source” to consider is “Search Engines.”
This source is derived from search engines like Google, Yahoo, and Bing. It happens when a potential customer does a search, finds your site in the Search Engine Results Pages (SERP,) and then visits your store.
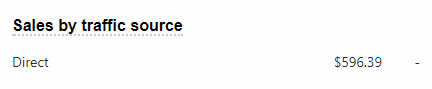
Sales by Traffic Source
This data gives you the overview of the total amount of sales acquired grouped by Traffic Source.
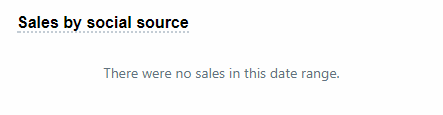
Sales by Social Source
This data gives you the overview of the total amount of sales acquired grouped by total online store sales that came from a social referrer source
Top Referrers by Sessions
This simply tracks the referrer to your site or the external websites that linked the traffic to your site.
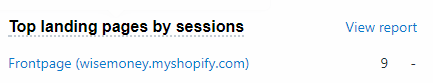
Top Landing Pages by Sessions
This gives you an overview of the top pages where your visitor lands and the number of sessions they dwell onto it. You can click View Report to see further details.
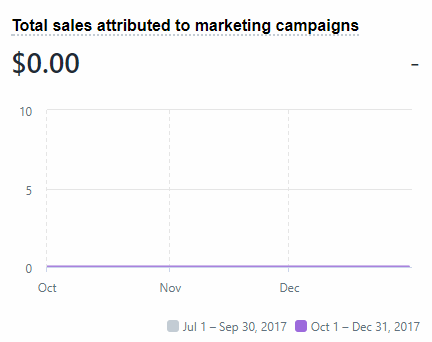
Total Sales Attributed to Marketing Campaigns
You can now view your total sales from your marketing campaigns as tracked by UTM parameters. This will help you know if your marketing strategy via campaigns is effective in giving you converted sales.
Sales by POS Location
This area gives you report of your total sales as categorized by POS location.
Sales by Staff
You can now track your employee of the month or whom among your employees goes the most productive with the data of total sales categorized by the staff that assisted your customer.
So now you know how to view your site traffic in the Shopify dashboard. In order to ensure your success, it is crucial that you utilize this information in a meaningful way.
Find trends, and notice correlations between outbound activities and traffic. Then, take action on these trends! Everything makes a difference, and the more you apply the information you learn from analyzing your reports, the further you will see your sales grow.
Comments