

Introduction
Google Analytics is an essential tool for your eCommerce store. It will allow you to better understand your visitors and customers so you can improve your traffic and revenue.
If you did not set up your tracking correctly, then you’re shooting in the dark – you’ll never know whether you’ve hit or missed.
Learning how to use the full potential of Google Analytics for your eCommerce site will make a huge difference in the growth of your business. Unfortunately, it will take some time to master it.
That‘s why we decided to explain the fundamentals to you, to help you to speed up your process.
How does Google Analytics work?
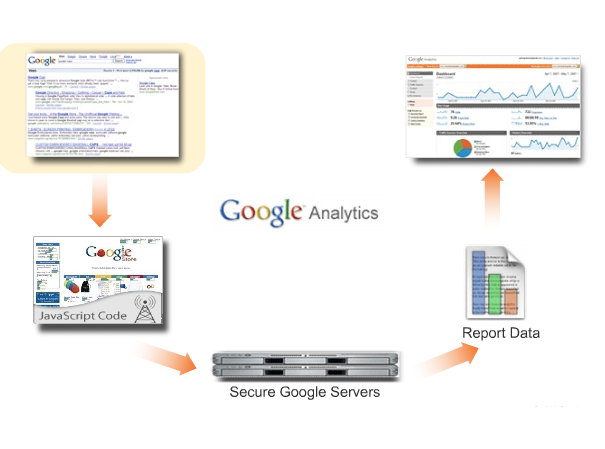
To collect information from websites, Google Analytics uses a small piece of JavaScript code integrated into the HTML.
When the user arrives at your site, this JavaScript code will began to collect various pieces of information about how he engages with the website – things like:
- The URL of the page the user is viewing.
- Browser and technical data (language set-up, device type, operating system, etc.).
- Referring traffic sources.
What kind of data can you track with Google Analytics?
With every analytics tool you’ll find two types of data:
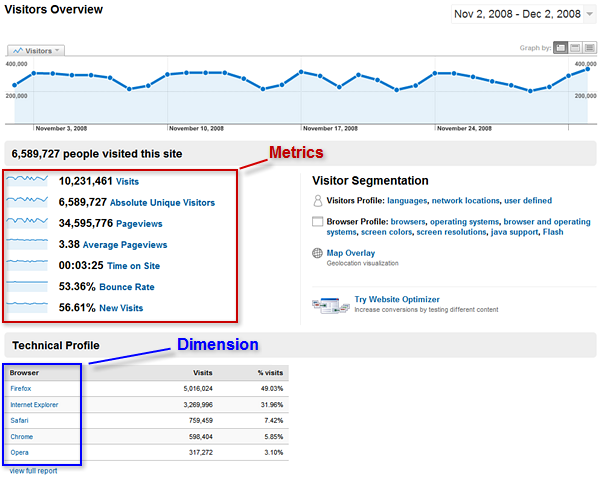
1. Dimensions: These are characteristics of the users, their sessions, and their actions.
Some examples for dimensions are:
- Geographic location for users
- Traffic source for sessions
- Name of the page viewed by user for actions
2. Metrics: These are quantitative data of users, sessions and actions. They are actual numbers.
Some examples of metrics are:
- Total number of visitors as an Audience metric.
- Average number of pages/visits as a Behavior metric.
- A purchase as a Conversion metric.
In general, you’ll be able to collect the following data from Google Analytics:
- Session or visit – user interactions with your site: stops when user has been inactive for 30 minutes. You can extend that for more than 30 minutes for video-streaming sites.
- Page view – counts every time a page is viewed on your site.
- Event – actions carried out by the user such as watching a video, or email sign up. This requires additional customization to be able to track it. Once a user does not generate an event in more than 30 minutes, this session will expire.
- Visit duration – the time from the first page visit to the last page visit
- Pages/session – the number of pages visited by a single person during the particular session
- New vs. returning visitors – the percentage of new and returning visitors
- Bounce rate – the percentage of users who visit only one page of your website and leave without browsing further. (This means that you’re probably setting up wrong expectations for users on the site.)
- Exit rate – the percentage of users who leave at a particular page of your site.
- Conversion rate – the percentage of users who purchase or complete an action on your site.
- Transactions – the total number of complete purchases on your site
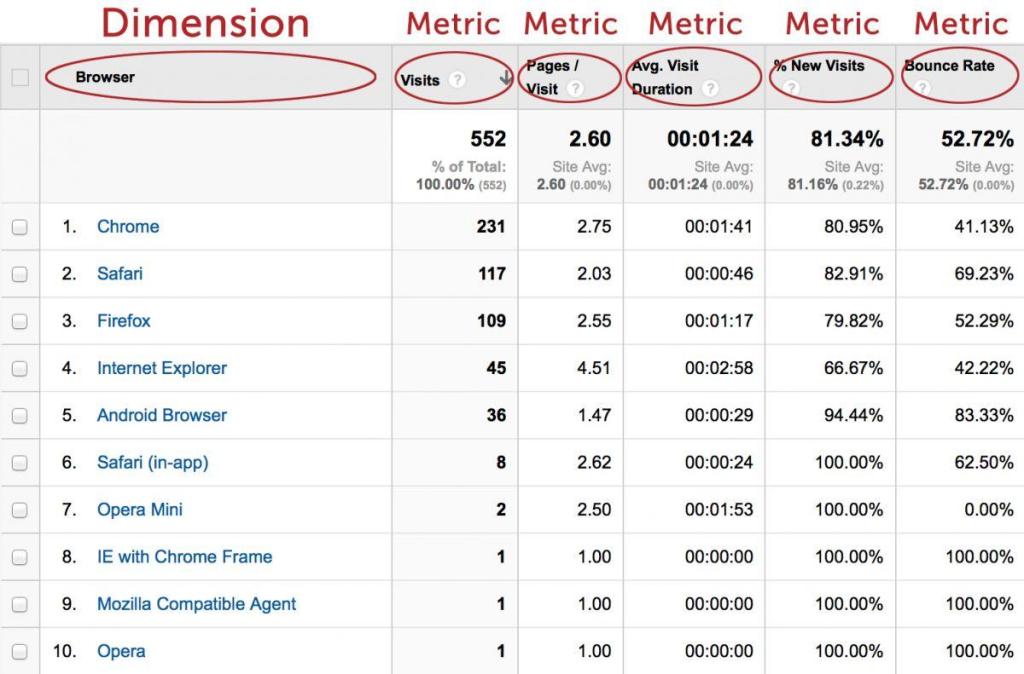
When you open Google Analytics, you’ll see that every report contains dimensions and metrics. They are most commonly reported in a table, with the first column representing the dimensions, and the rest of the table displaying the corresponding metrics:
First let’s clarify the difference between vanity metrics and actionable data.
Google Analytics allows you to tracks tons of metrics. Sadly, most of them don’t really matter for your business’ growth. We can separate the data we collect into two main categories:
Vanity metrics – These look good on paper, but don’t really show whether your business is doing better or worse. These are things like page views, bounce rate, time on site.
Actionable data – These are the actual metrics that matter for your business. They show you that you’re doing an amazing job and that you need to go in the same direction. Some great examples would be: active users; engagement; conversion rates; customer acquisition cost; and ultimately, revenues and profits.
Why is this important?
If you track only the vanity metrics, then you’ll get a false sense of success. Just because your eCommerce website has loads of traffic, this doesn’t mean you have a great business. At the end of the day, it doesn’t mean a thing if you have a low conversion rate, but only a few thousand of them become customers.
How to use Google Analytics to track and improve your online performance?
Before you start implementing Google Analytics on your site, you should take the time to create a measurement plan. By doing so you’ll know which metrics to track; why; what they mean; and how to use them to improve your business results.
To create your effective measurement plan, follow these five simple steps:
Step #1: Identify growth goals by creating your buyer personas, value proposition and business goals.
For example: The main business objective for EVO is to help people enjoy winter sports using their ski and snowboarding equipment, and thereby cultivate their love for extreme sports. They also want to increase their online sales in the upcoming months.
Step #2: Identify strategies and tactics to achieve these goals. Your plan must include both strategies (high-level plans) and tactics (specific methods) in order to guarantee success.
For example: The main strategy for EVO to increase sales is to sell more ski and snowboarding equipment. They plan to do this by implementing tactics for:
- increasing organic traffic with SEO.
- increasing conversion rates with A/B testing.
- upselling additional products at the moment of purchase.
Step #3: Identify Key Performance Indicators (KPIs) – These are the metrics that you’re going to use on a daily business to understand how your business is performing.
EVO would be interested in tracking things like:
- organic traffic.
- conversion rate.
- average order size.
- number of purchases.
- sales.
This is a list of 32 Key Performance Indicators (KPIs) you can track for Ecommerce. Choose the ones that matter for your business.
Step #4: Choose how to segment your data – Document which segments of data it’s important to measure for the success of your eCommerce business.
For EVO this could be:
Marketing channels such as organic search:
- New vs. returning visitors
- People who buy specific snowboarding equipment
Check out this post for 16 Secret Google Analytics Advanced Segments.
Step #5: Choose targets for each KPI – This will help you understand whether your business is doing well or poorly over time. Without this information you will never know whether you’ve achieved your goals.
EVO might set the following targets:
- 1M unique visitors from organic search
- 1.5% conversion rate
- $2,500 average order size
How to setup Google Analytics eCommerce tracking
To start collecting data with Google Analytics, follow these five steps:
Step #1: Create a new, or use your existing, Google account. You can create one from here if you don’t have it yet. Otherwise, log in and go to Google Analytics.
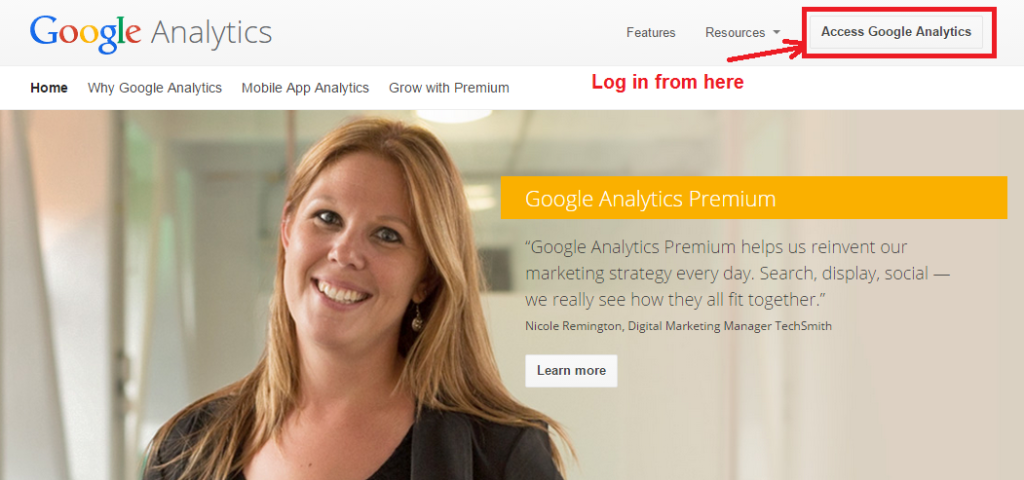
Step #2: Log in to your Google Analytics account and click on “Create new account”.
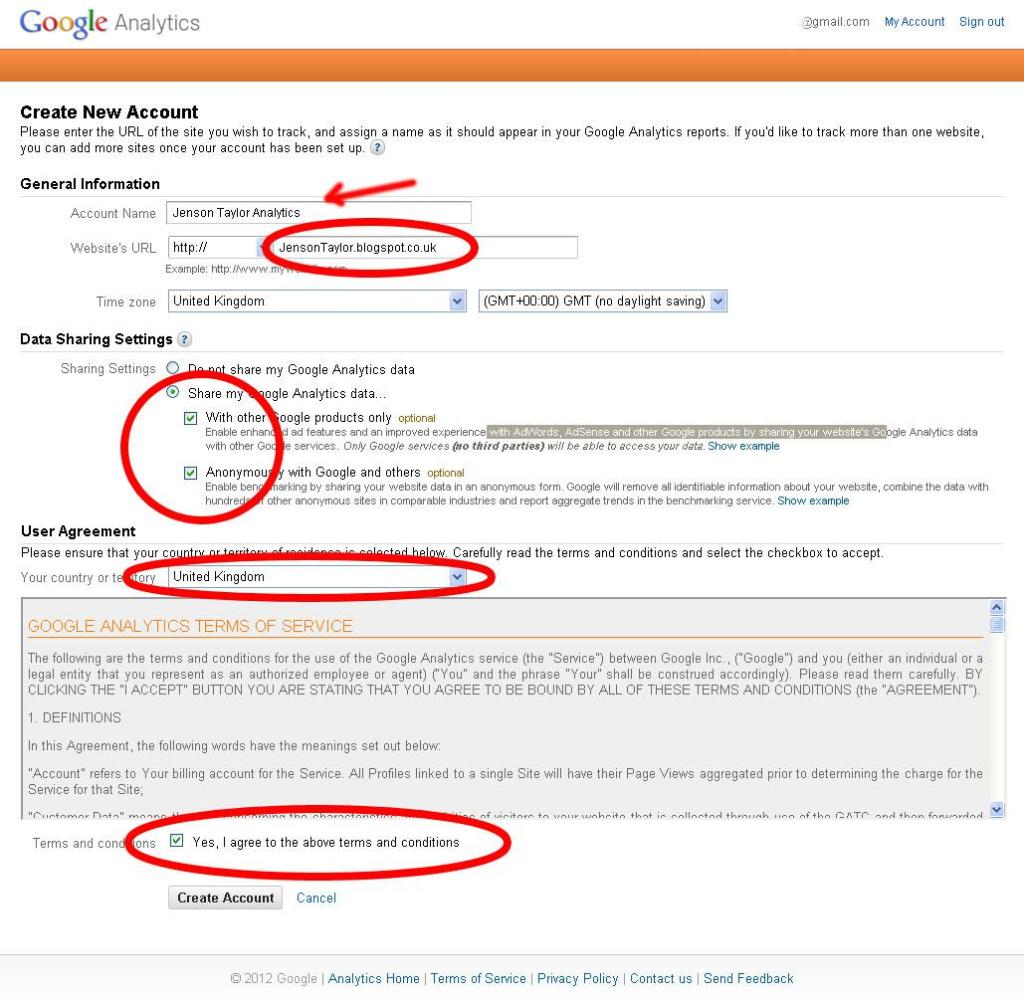
Fill out the data fields, and on the next page you’ll get the tracking ID code.
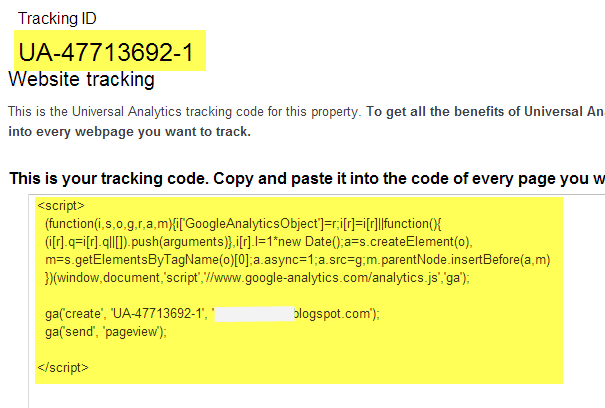
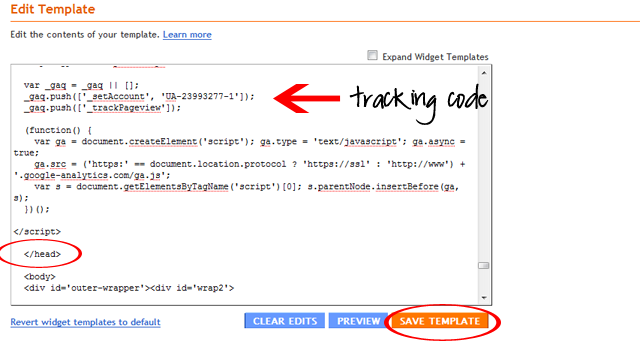
Step #3: Set up tracking ID code on your site by copying and pasting your tracking ID on every single page of your eCommerce site that you’d like to track. The best location for the code is at the end of head tag.
Some eCommerce platforms like Shopify allow much easier integration: just copy and paste the JavaScript code inside the plugin/admin panel.
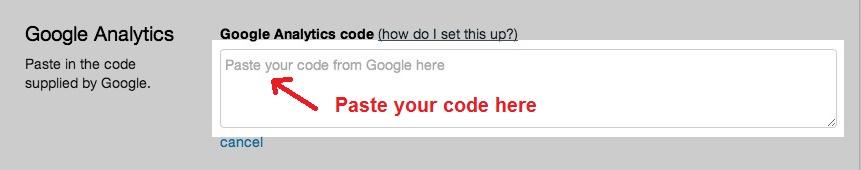
For Shopify, open your admin. and go to Settings > General
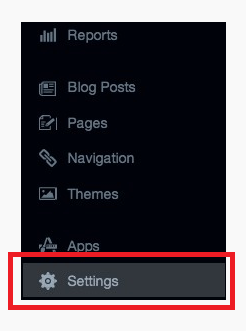
Then paste the code into the Google Analytics field.
Step 4: Turn on the ecommerce tracking feature. For eCommerce sites you’ll need to perform one additional step to be able to track things like sales and average order size. To turn on this feature do the following:
Enable eCommerce tracking within your analytics website deal.
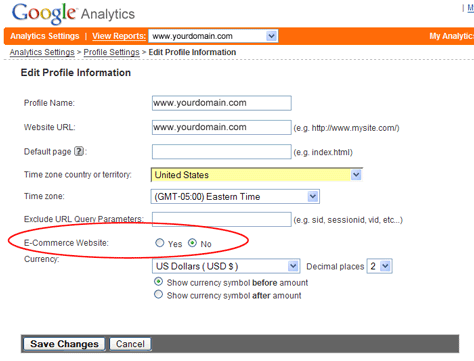
Add your Google analytics code to your “Transaction complete” page.
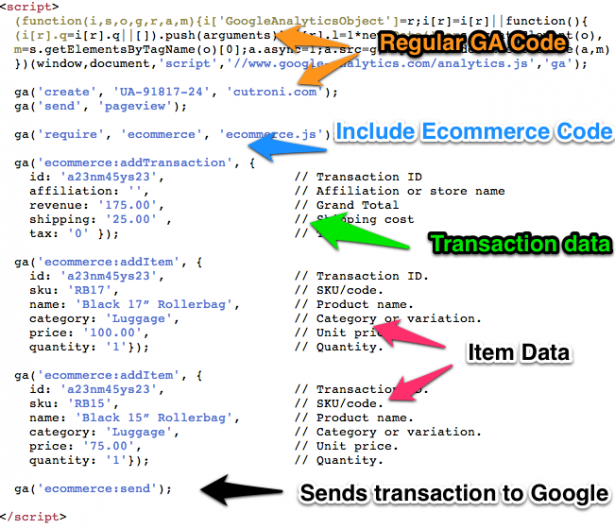
Add additional eCommerce tracking code receipt pages so you can capture the deals of each transaction.
After this, your Google Analytics will be fully operational and you’ll start to collect data for your reports.
Understanding basic reports
All of the data tracked by Google Analytics is presented in form of reports. There are five standard ones that don’t require any customization:
Real-time – This shows real-time statistics about the people currently on your site – things like who is on your site at that very moment; where they came from; their geographic location; and what pages they’re browsing.
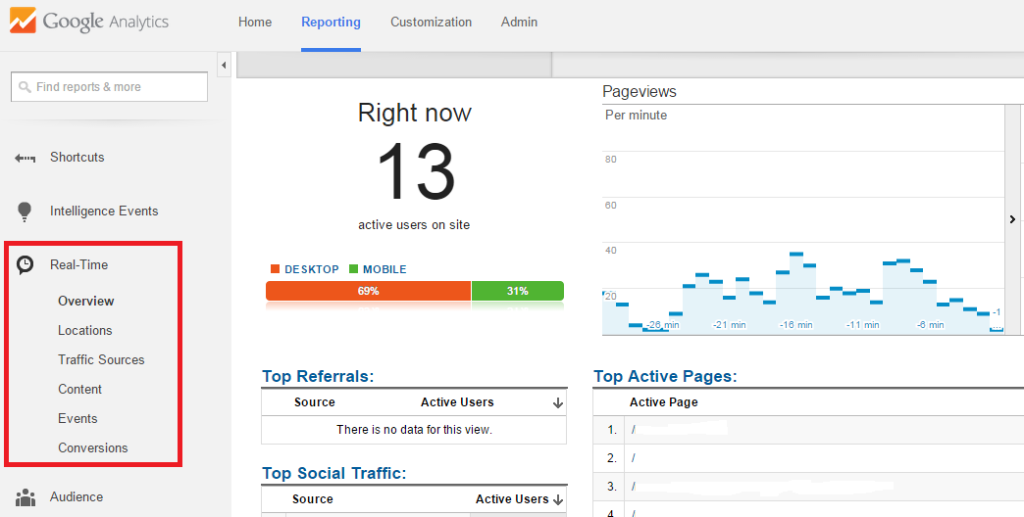
Real-time data is rarely useful; however, it can help you to better understand:
- whether the data you’re tracking over time is correct
- the immediate results from your marketing campaigns.
- the results from A/B testing and multi-funnel testing within minutes.
- the pages users are viewing at the moment, so that you can publish, adjust and modify your content in real time.
For more information on this topic read the blog post 4 Ways to Harness the Power of Real-Time Analytics.
Audience: This section has been created to help you better understand your website visitors.
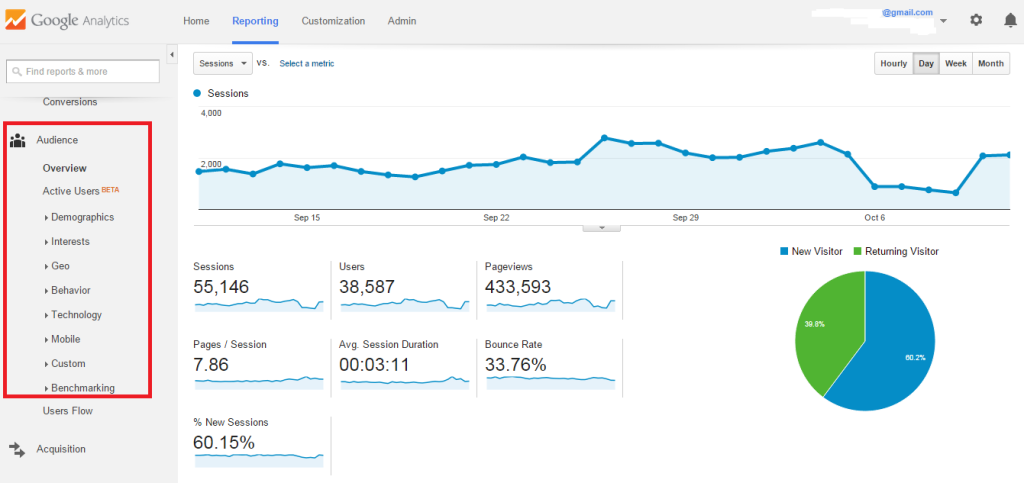
By tapping into the data from this report, you’ll learn more about:
- the demographics of your visitors (i.e. age, gender, location, language, etc.).
- the interests of your visitors.
- the behavior of your users (i.e. new vs. returning visitors, frequency and recency of visits, and level of engagement with your content).
- the technology your visitors are using (i.e. browsers, operational systems, devices, etc.).
- users’ flow (the sequence of pages people visited to complete a purchase).
The information from this report will help you to:
- understand your customer profile better, which will result in more marketing-effective campaigns targeting them.
- improve your logistics according to your top demographic locations.
- adjust your website according to the technology that people use to access it (i.e. devices, browsers, etc.).
- improve site speed depending on the locations of users.
To better understand this report, read the blog post How to Use Google Analytics Audience Data to Improve Your Marketing.
Acquisition – This is one of the most important reports in Google Analytics. It allows you to understand engagement and sales, and which channels brought more visitors to your eCommerce business.
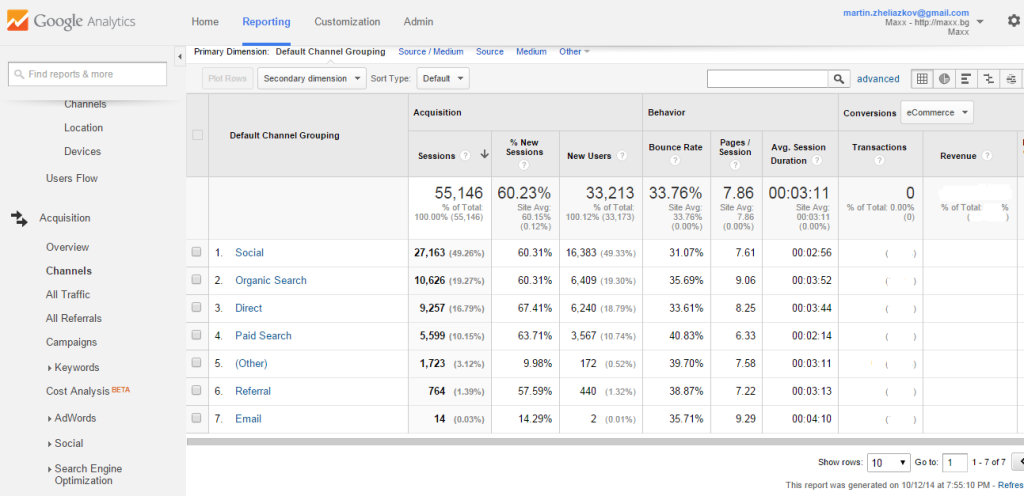
Acquisition shows Metrics (sessions, % new sessions, bounce rate, pages/sessions, transactions, revenue, eCommerce, conversion rate) for:
- each channel (organic search, paid search, social, direct, email, etc.).
- each traffic source page (Techcrunch.com/trends-in-ecommerce).
- each referral (e.g. Facebook).
- each campaign (e.g. AdWords campaign for slim jeans).
- paid keywords that brought the most traffic to your site.
- social channels.
- organic search.
It will also help you understand:
- the channels that are driving more traffic and sales.
- the websites linking to you.
Behavior – This report allows you to understand how well your content is performing so that you can improve your SEO and conversion optimization efforts.
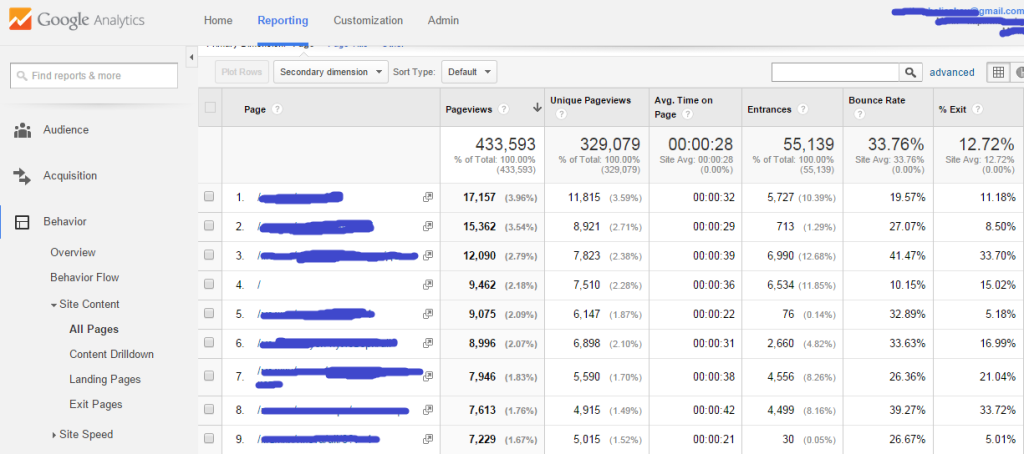
The behavior report displays metrics for each page of your website (pageviews, unique pageviews, entrances, bounce rate, exit rate, page value).
You are also able to see the top landing and exit pages, to analyze average load time, and to track site search keywords and events.
You can use the information from this report to do the following:
- Get keyword ideas from site search
- Analyze how landing pages are converting, and make improvements to the ones not performing well
- Analyze your exit pages and see which ones need improvements
- Understand behavior flow on your site
To better understand this report, read this.
Conversions – To be able to use this report, you need to turn on eCommerce tracking, as we mentioned before.
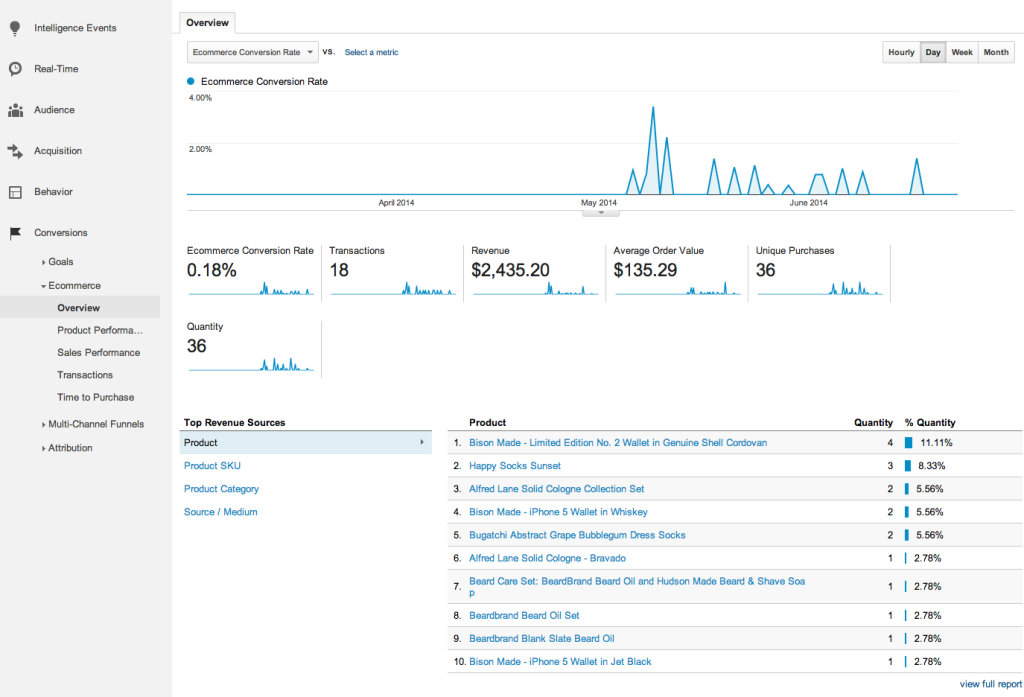
From Conversions you’ll be able to learn more about:
- which products visitors buy on your site, in what quantity, and the total revenue generated by the order.
- the revenue and number of products for each order.
- the time and number of visits needed for the customer to complete the transaction.
This data will allow you to better understand:
- which are the top-selling products on your site, so that you can push them more.
- how much time people need to decide before buying your products, so that you can improve your conversion campaigns.
How to segment your data?
With segmentation you‘re filtering data in real time with the aim of isolating and comparing metrics so that you can see which segments are underperforming. It’s extremely useful for understanding your business performance, and filtering actionable take-aways.
Segment by users – Multiple sessions within the date range you‘ve selected, such as all the goals users competed or all the revenue generated by a user.
You can compare users who made purchases to users who didn‘t make purchases. This analysis will help you understand what influences people to buy.
Segment by sessions: The data here draws the user behavior from a single session, such as goals competed during the session or the amount of revenue generated by the user during the session.
For example: you can segment sessions based on traffic source / paid search, and compare it to organic search.
Both segments can be built on:
- dimensions.
- metrics.
- session dates.
- user actions.
When you go to Audience, you’ll see that all of the Sessions segment already applies to the Audience section, which includes all sessions within the selected date range.
Click the arrow to open up the segment builder. You’ll see a list of commonly used segments. You can compare up to four segments at any one time by clicking the segment label or dragging it into the empty fields at the top of the report. You can also remove them by clicking “x” on the already selected ones.
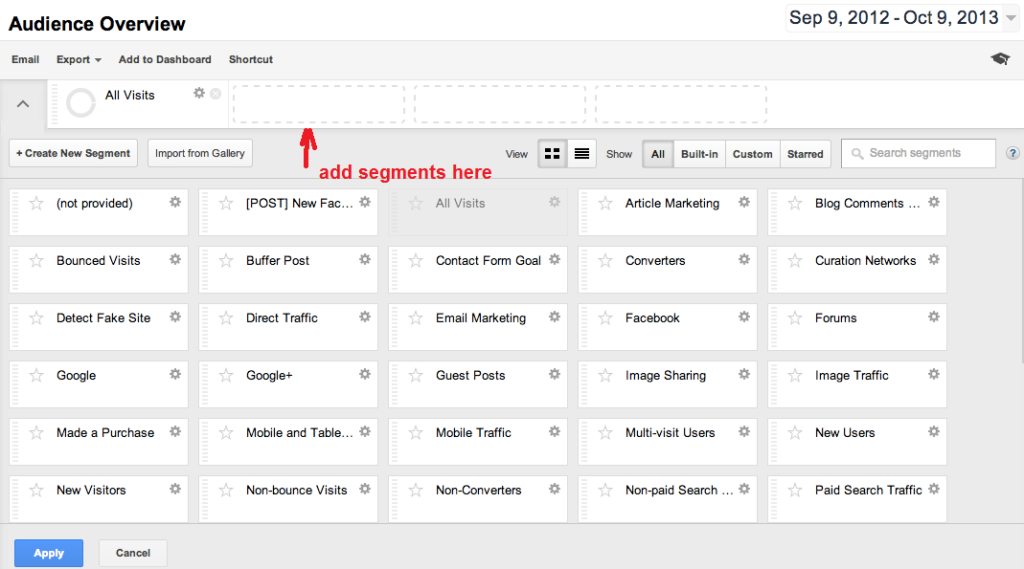
When you’ve selected your segment, click on “Apply” at the bottom. You’ll see each of your segments represented by a time graph and a data table. Once applied, segments will show in your other reports as well.
To create a custom segment, simply click “Create new segment”. Start by giving the segment a name, then choose your criteria from the categories on the left to filter your data.
For example: you can choose language from the demographics category and filter it for only those who speak Spanish. You can even create customization based on sequences of custom interaction.
How to set up goals to analyze your funnel?
Goals allows you to map the data with the KPIs that you want to track. With them you can easily analyze your funnel and understand which pages are killing your conversions.
Type of goals – there are four types of goals that you can create in Google Analytics:
- Destination (page) (Simply enter the request URI to use this.)
- Duration (five minutes)
- Pages/visit (three pages)
- Events (registration) (You need to have event tracking implemented to use it.)
Specify monetary value as a goal – This will allow Google Analytics to count a goal conversion as an actual revenue.
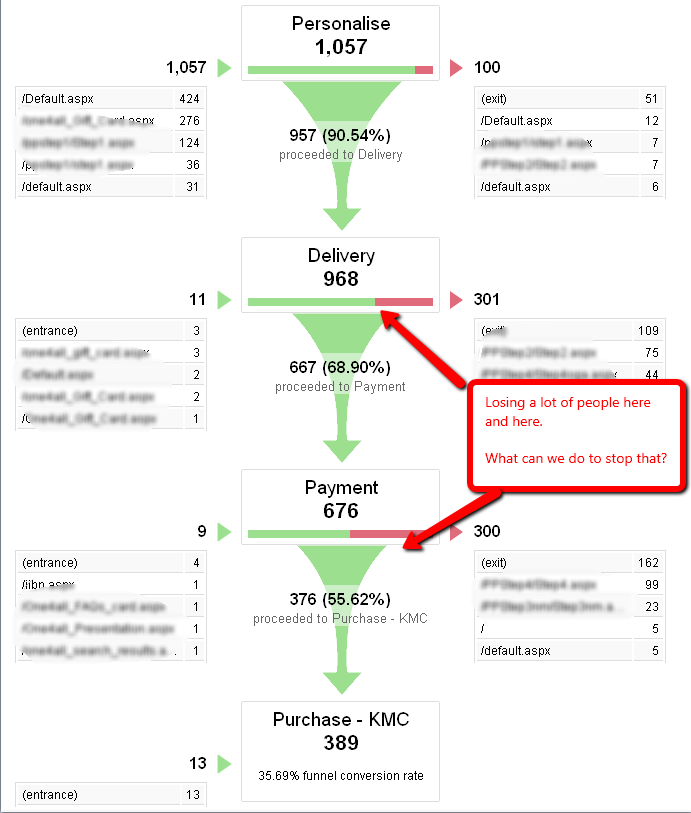
Set up your conversion funnel – Design and track the actual path of all visited pages that lead to an order completion.
For example: To complete a transaction the user must add items to a card, fill out shipping information, and submit payment information. Then he’ll be redirected to the Thank you page.
To build a funnel, specify all of the pages leading to the goal. You can also name each step of the funnel that will show up in your reports.
Setting up goals also activates multi-channel funnel reports displaying typical paths towards conversions.
eCommerce reporting – It tracks important sales activities and performance for your online store, such as:
- transactions.
- revenue.
- conversion rates.
- unique purchases.
- quantity.
- product purchased.
- number of times people visited before purchasing.
- Etc.
The eCommerce reporting is very similar to the goal reporting, with one small difference – goal conversions are tracked as one per visit. Therefore, if one user buys several products per visit, it will be counted as one conversion.
eCommerce conversions are tracked multiple times per visit. If a person buys three products per visit, it will be counted as three conversions.
Remember: add goal value only for non-eCommerce activities, otherwise your revenue will be counted twice.
Conclusion
To take your skills to the next level, we suggest you go to Google Analytics Academy and take the advanced course Ecommerce Analytics: From Data to Decisions. By doing so you will learn advanced techniques for tracking and analyzing data that will allow you to better improve your marketing efforts and sales and take them to the next level.
Comments