
Have you ever tried to look into your sales conversions on the Shopify dashboard but come away feeling overwhelmed?
Today, let’s take a deep dive into understanding the sales conversion metric on your Shopify dashboard. Because, getting a ton of traffic on your site is great, but if you aren’t converting your visitors into sales, then ultimately, your traffic is for naught.
By analyzing these reports, you are able to correlate specific time periods with sales, which then helps you determine actions that in turn drives measurable results.
Step #1: Go to the admin section of your Shopify store: Then click “Analytics”
Step #2: Dashboard under “Analytics” gives you the overview of Total Sales, Online Store Sessions (Site traffic), Returning customer rate, etc.
A preview of these sales metrics are also shown on your Shopify’s main dashboard.
Total Sales
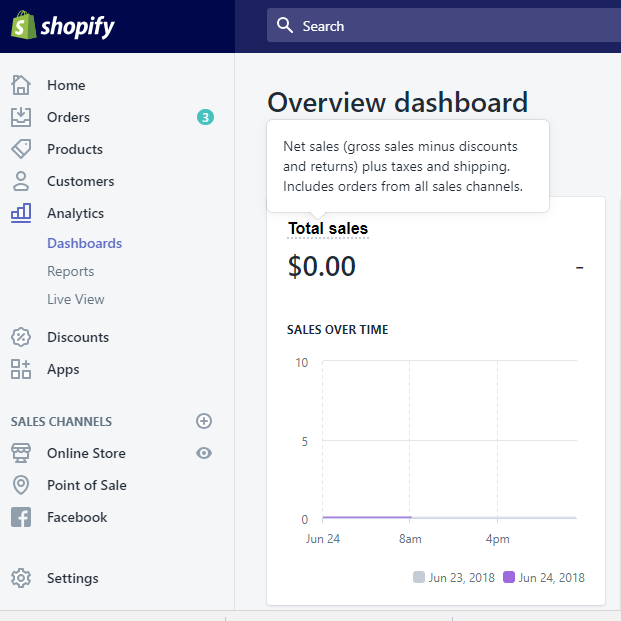
This will help you monitor your sales growth and can also help you build your marketing strategy and even strategic selling and promotions. All metric boxes under Analytics Dashboard can be modified with certain dates or time frame.
Online Store Conversion Rate (Website Conversion)
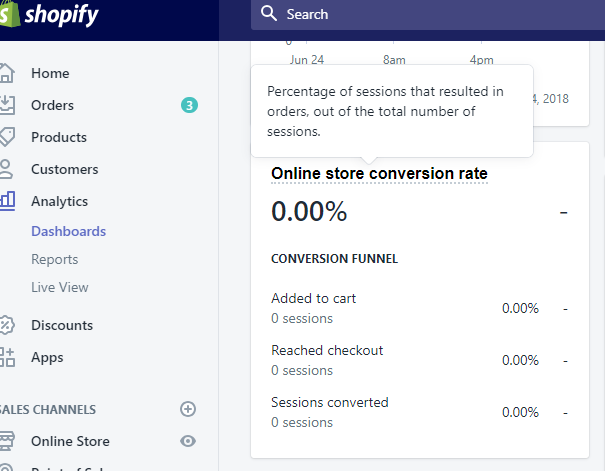
The website conversions metric shows you how many people add products to the cart in relation to how many people make it to checkout. Then, the final number shows the volume purchased from the cart.
This information is crucial, and can help you identify user experience issues, such as a customer’s check out experience.
Now how are the conversions calculated?
- Added to Cart indicates the number of customers who have added at least one item to your cart.
- Reached Checkout demonstrates the number of customers who have added at least one item to their cart and reached your store’s checkout.
- Sessions Converted (Purchased) pinpoints the number of customers who have added an item to their cart, and successfully completed their purchase.
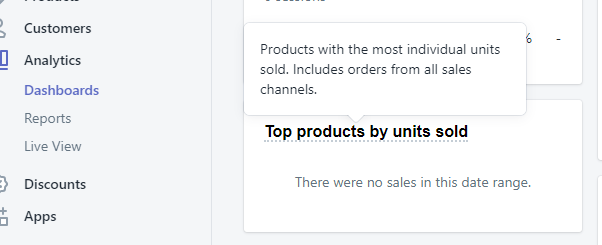
Top Sellers or Top products by units sold is a list of your top three selling products. From both a marketing and production perspective, it is critical that shop owners are always aware of their best selling products for promotional, branding and manufacturing purposes.
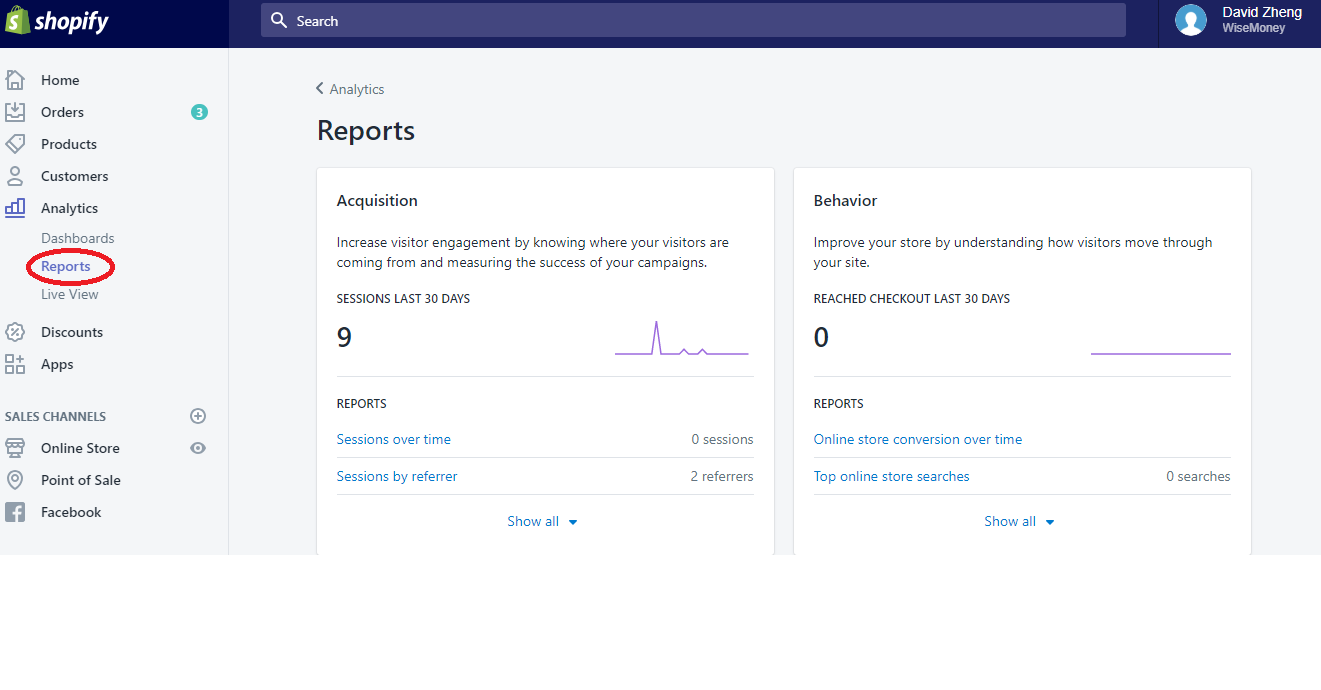
If your store is on the professional plan or higher, you can click “Reports” (which only populates once you have best selling products) to get a full report of Sale by product. There, you are able to see the other products that are selling well in rank order.
So now you know the basic functionality of the sales conversion metrics in the Shopify dashboard.
Use this knowledge to plan and take action! Making small changes daily to your strategy, thereby allowing you to determine what works and what doesn’t.
These reports will empower you and your business strategy. Good luck!
Comments